Examples
Insolation toolbox
Insolation toolbox
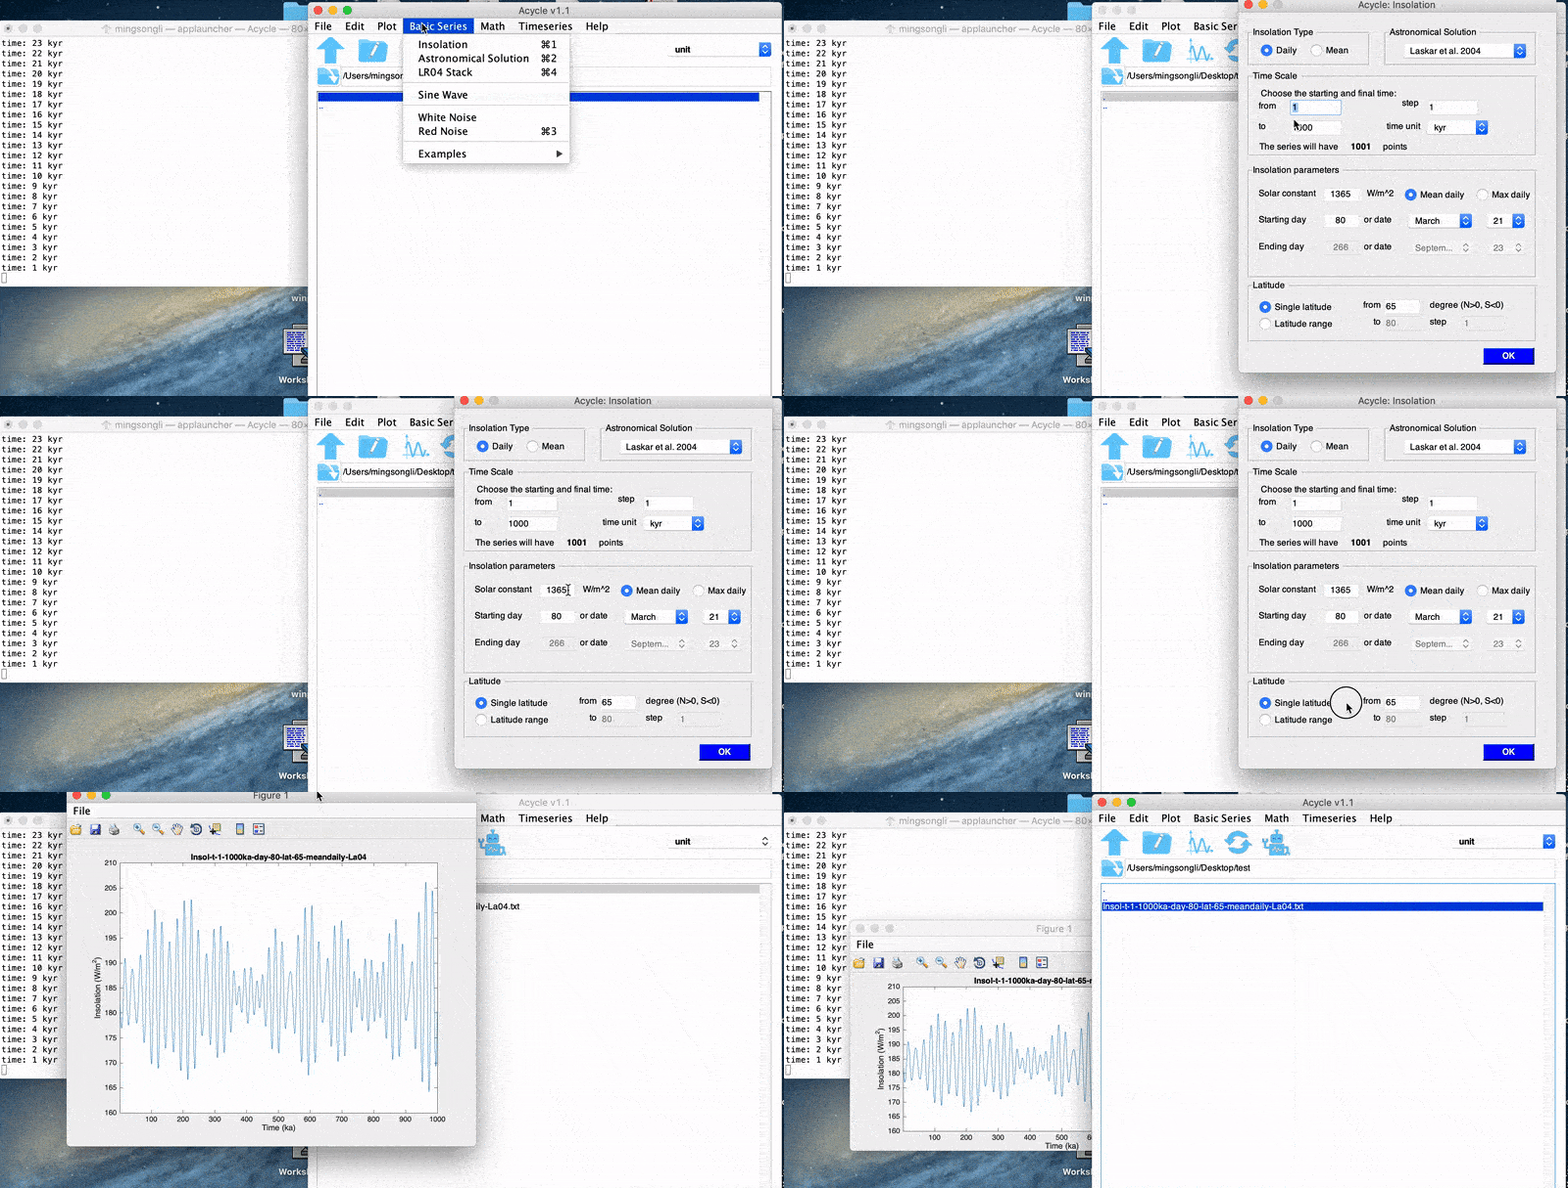
This GUI generates the mean daily insolation series on March 21 for the 1-1000 Ka at 65°N using the La2004 solution with a solar constant of 1365 w/m^2.
Insolation map
Insolation
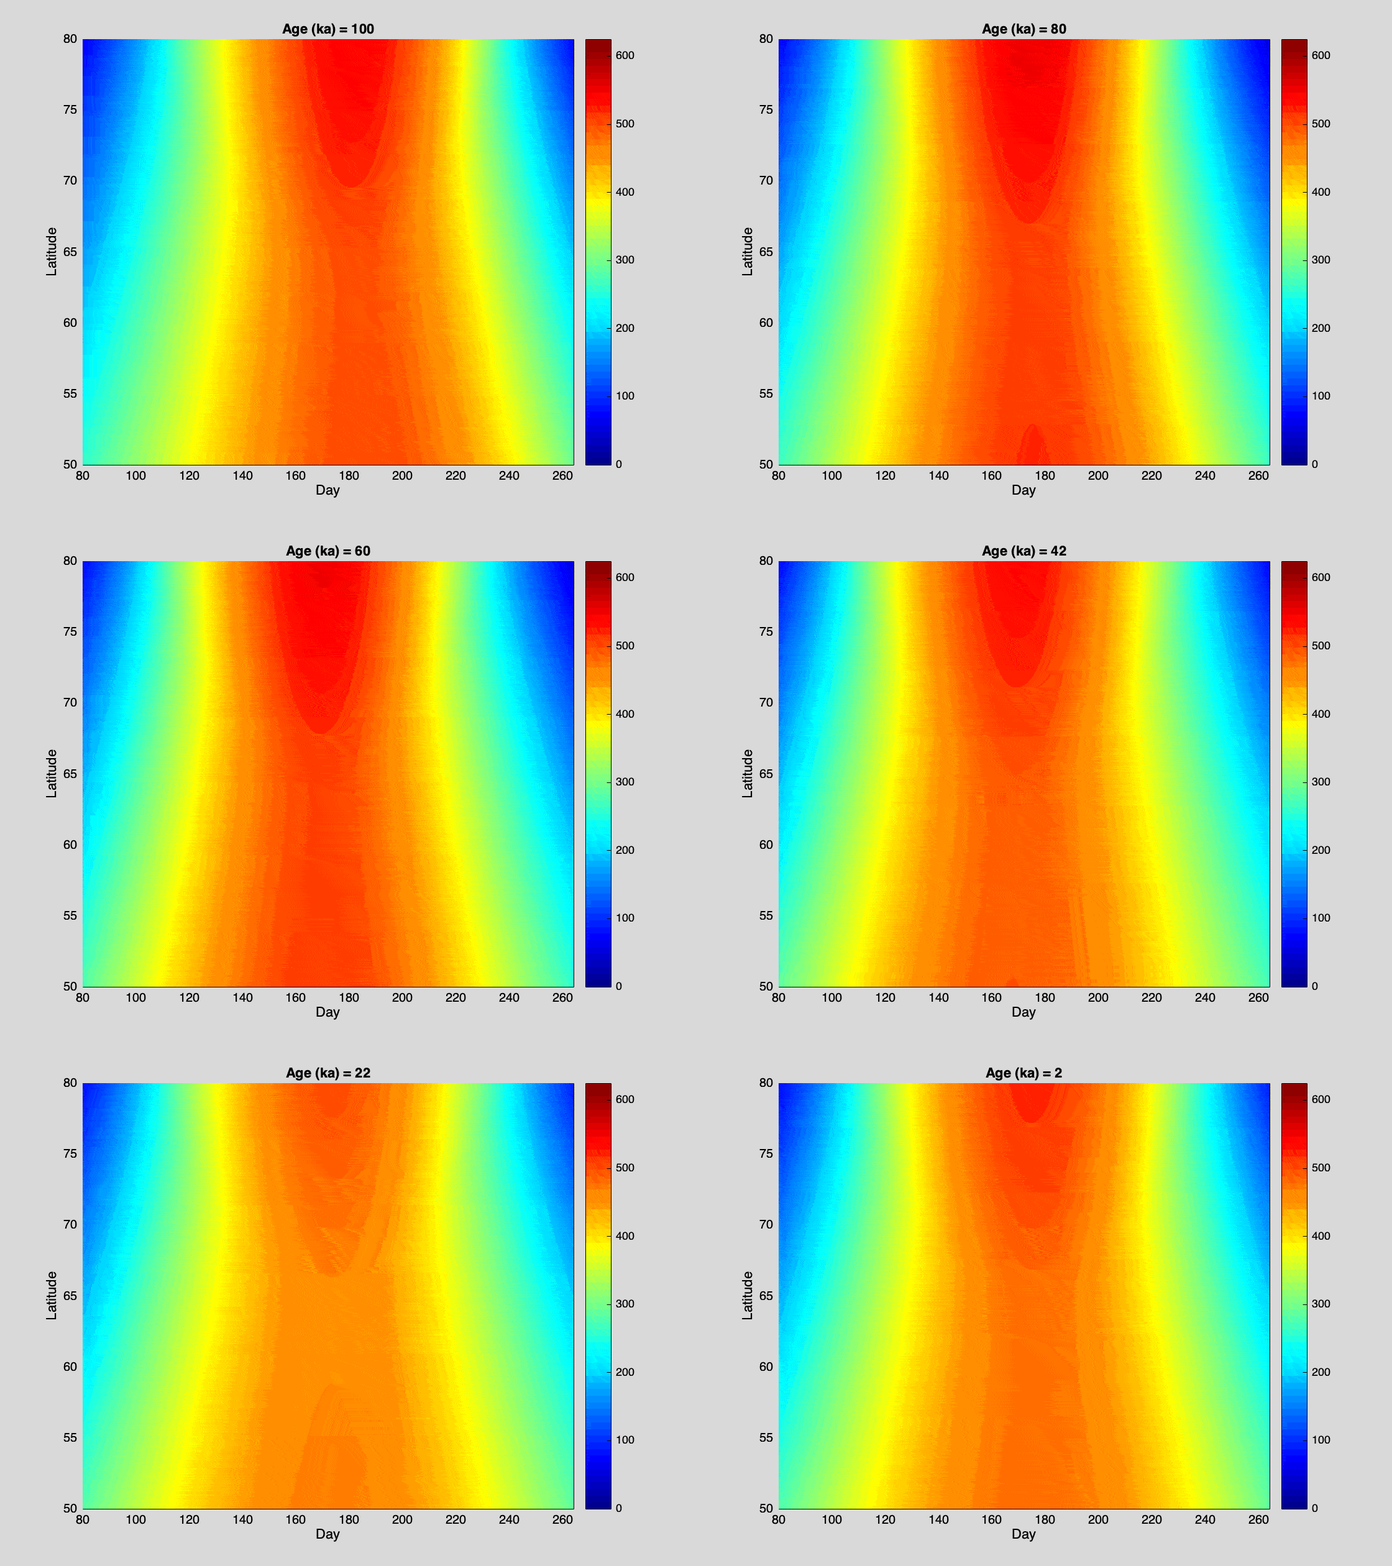
Mean insolation map from March 21 to Sept. 23 for the past 100 kyr (1-100) at 50-80°N using the Laskar et al. (2004) solutions. The calculate uses a solar constant of 1365 w/m^2
Most Used Tools
More
For beginners: How to calculate the dominant wavelengths of a stratigraphic series?
Read Users' Guide for more examples


